
Bring your data to life with stunning visual dashboards showing connected trends instantly.
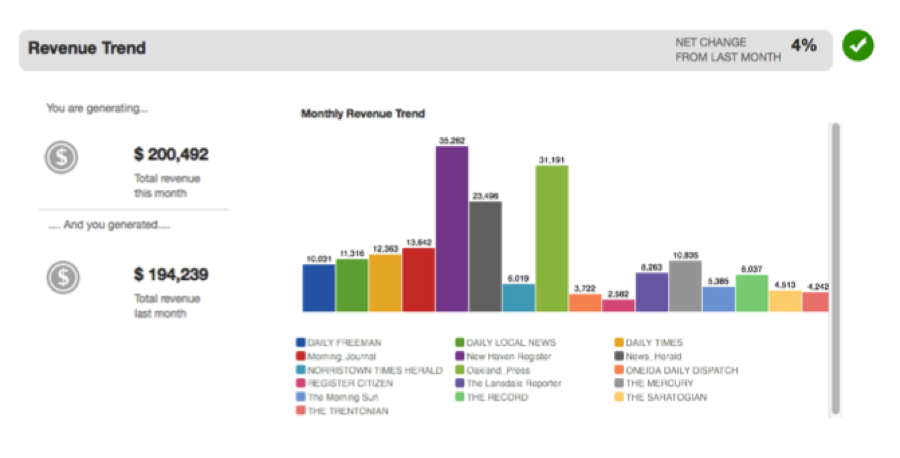
How is your revenue tracking this month compared to last month? What is the revenue breakdown by region, and which region is performing below expectation? Presenting needed information in a visual way helps you spot trends immediately and identify areas requiring attention.
Use bar charts, pie charts or any number of graphical formats to highlight the trending of your data.
Use predefined icons or custom images to organize your data in a visually appealing way.
Add dynamic filters and drill-downs so you and your users can slice and dice the data on the fly.